
Looking Closer
Understanding forcible displacement across the world
WITH THANKS
We would like to take this opportunity to thank our partners for enabling us track the effects of forcible displacement by providing rich datasets, research support, and guidance related to global natural disasters.
RESEARCH PARTNERS
DATA PARTNERS


FOREWORD
DURHAM UNIVERSITY
This is a very timely report that creatively uses data-driven methods to expose the patterns, scale, and impact of forcible displacement across different types of natural disasters including cyclones, volcanic eruptions, earthquakes, and floods, in 18 different countries. To do this, Nostos Homes uses displacement datasets collected by the Meta Data for Good team. They also attempt to study the influence of attributes like gender in these patterns.
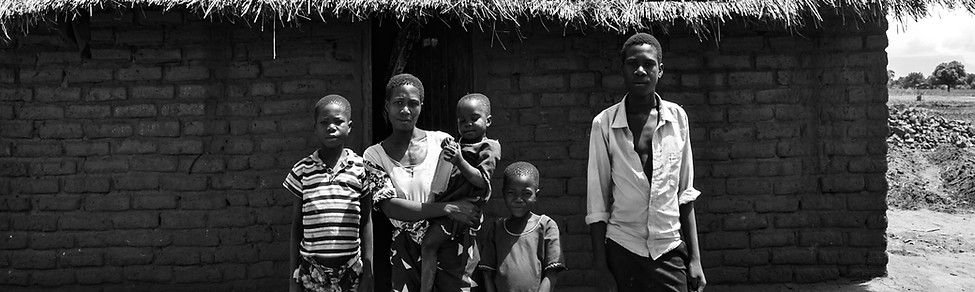
Presently, forcible displacement is a grim reality for 86.5 million people across the world due to natural disasters and conflicts. Understanding the circumstances that lead to them losing their homes is an important step in extending help more efficiently. In this report Nostos Homes attempts to do exactly this by studying how populations move on a macro-level in the aftermath of a disaster in order to make more informed decisions on where Nostos Homes’ communities can be set up to provide the most critical help. The results reported in this study also identify new use cases for Nostos Homes shelters. Finally, the report explains the life cycle of these shelters by mapping them across the patterns of displacement.
Durham University is proud to support Nostos Homes in its endeavour to uncover critical insights regarding forcible displacement. We hope that this report will be a step in the right direction and will motivate more research that uses data to guide quick and efficient decision-making to aid families that face forcible displacement.

Professor Claire O’Malley
Pro-Vice-Chancellor (Global)
Durham University

Professor Christos Tsinopoulos
Associate Dean for External Engagement
Durham University Business School

FOREWORD
META DATA FOR GOOD
Forced displacement – whether due to a conflict or a major natural disaster – is a global challenge affecting the well-being of families forced to flee their homes, as well as the communities in which they resettle. Trends on international displacement have typically been developed through a combination of sources, including survey data and information on border crossings. However, the use of mobile phones and social media among displaced communities allows technology companies like Meta to contribute new information to this landscape, using de-identified GPS data to uncover where populations are leaving from and where they are going to.
The Data for Good at Meta team started working on displacement maps in 2018 to help international organizations better understand how many people were displaced by natural disasters. In addition to sharing insights on weather-based displacement, this methodology has proven instrumental in helping groups better understand the rate at which populations affected by the war in Ukraine have relocated to other countries and the transition pathways they’ve taken before resettlement.
The collaboration with Nostos Homes and the Data for Good at Meta program is a testament to how the private and nonprofit sectors can each bring their unique skills to support communities affected by crises. Nostos Homes has on-the-ground experience working with forcibly displaced communities around the world, and the Data for Good at Meta team can offer novel datasets that create a clearer picture on the size, scale and location of displaced communities. Working together, both teams’ work has become stronger and more richly informed.
We hope this report will motivate further data-driven efforts to focus aid efforts during disasters and support innovations to help displaced people around the world.

Laura McGorman
Director, Data for Good at Meta

INTRODUCTION
UNDERSTANDING INTERNAL DISPLACEMENT
The period of December 2021 - March 2022 witnessed an unprecedented number of natural disasters, leading to people getting forcibly displaced across the world. Here’s an attempt to understand the magnitude of impact of such disasters on global displacements, with the help of Meta’s displacement datasets.

Forcibly displaced people across the world due to natural disasters
OVERVIEW
Dataset interval: 2 days to 2 months based on crisis according to available datasets
21
crises
These include cyclone, volcanic eruption, earthquake, flood, landslide, fire & tropical storm
8.17M
people displaced
These include people who were displaced and did not return, out of 453.8M people studied
18
countries
Across six continents - both northern and southern hemispheres
10.8M
people returned
These include people returning back to their home cities after the crises
1344
cities
These are the affected cities, also known as baseline home cities of displaced communities
625K
displaced abroad
These include the affected communities moving to a foreign country due to onslaught of crises
CHRONOLOGY
Occurrence in the 3 months period (December 2021 - March 2022)


CRISIS
CONCLUSION
Global scope of impact for natural disaster affected regions
While natural disasters affected people all over the world during December 2021 - March 2022, different regions were affected disproportionately. People in South East Asia witnessed maximum forcible displacement, followed by South and North America.
Layering it with GDP per capita helps us understand the potential focus areas where providing aid in terms of shelters, health centers, schools, access to food etc. will help maximum no. of people. Regions with low GDP per capita (such as South East Asia) are less likely to cope with the aftermath of natural disasters, therefore the highest scope for impact by the actions of aid agencies lies in such regions.
Region | No. of people displaced | GDP per capita |
|---|---|---|
South East Asia | 5.2M | $11,124 |
South America | 1.9M | $7,374 |
North America | 378K | $17,886 |
Australia | 55K | $11,531 |
Europe | 35K | $31,053 |
Africa | 25K | $2,241 |
Oceania | 47 | $3,769 |

Schematic prioritisation of areas affected by natural disasters based on no. of displaced people as per studied datasets (not to scale)
RESOURCES
BIBLIOGRAPHY
Image credits:
Dataset credits:
Crises descriptions:


RESOURCES
DATA ASSUMPTIONS
Fields used
Home City Information
-
Home City Name (baseline_polygon_name) - Name of city where people originated, i.e. where their pre-crisis home was
Current City Information
-
Today City Name (today_polygon_name) - Name of the city where people are located as of the associated date (ds)
Displacement Metrics
-
Gender (gender) - whether the reported metric represents 'male', 'female', or 'overall'.
-
Status (status): indicates the displacement status of the people represented on a current day. This defines whether people are displaced, never displaced, unknown, or returned.
-
Percent of total in city at onset (percent_of_total_in_city_at_onset): Percentage of people of the given gender in this category out of total population of the given gender in home city before the event

Datasets’ period used for the study
CRISIS | MIN DATE | MAX DATE | DAYS |
|---|---|---|---|
The Volcanic Eruption at Mount Semeru, East Java, Indonesia | 24/01/2022 | 26/03/2022 | 61 |
The Flooding Across Pahang, Malaysia | 17/01/2022 | 19/03/2022 | 61 |
Typhoon Odette Across Central Philippines | 11/01/2022 | 13/03/2022 | 61 |
The Cumbre Vieja Volcanic Eruption in La Palma, Canary Islands, Spain | 14/01/2022 | 16/03/2022 | 61 |
The Marshall Fire in Boulder County, Colorado, US | 26/01/2022 | 26/03/2022 | 59 |
The Flooding in Jayapura City, Papua, Indonesia | 25/01/2022 | 26/03/2022 | 60 |
The Flooding Across Southeastern Minas Gerais, Brazil | 27/01/2022 | 24/03/2022 | 56 |
The Flooding in Antananarivo District, Madagascar | 04/02/2022 | 26/03/2022 | 50 |
Tropical Storm Ana Across Northern Mozambique | 09/02/2022 | 26/03/2022 | 45 |
Tropical Cyclone Batsirai in Eastern Madagascar | 13/02/2022 | 26/03/2022 | 41 |
The Earthquake in Selayar Islands, South Sulawesi, Indonesia | 11/01/2022 | 13/03/2022 | 61 |
The Landslide in La Gasca, Quito, Ecuador | 17/02/2022 | 26/03/2022 | 37 |
The Flooding in Metropolitan Region of Sao Paulo, Brazil | 16/02/2022 | 26/03/2022 | 38 |
The Flooding Across Northeastern Haiti | 17/02/2022 | 26/03/2022 | 37 |
Cyclone Batsirai In Madagascar | 20/02/2022 | 26/03/2022 | 34 |
The Landslide in La Esneda, Pereira, Colombia | 25/02/2022 | 26/03/2022 | 29 |
The Flooding in Petrópolis, Rio de Janeiro, Brazil | 04/03/2022 | 26/03/2022 | 22 |
The Earthquake in West Sumatra, Indonesia | 13/03/2022 | 26/03/2022 | 13 |
Tropical Cyclone Gombe Across Nampula Province, Mozambique | 24/03/2022 | 26/03/2022 | 2 |
The Flooding in Northern New South Wales, Australia | 15/03/2022 | 26/03/2022 | 11 |
The Flooding in Southern Region, Malawi | 11/02/2022 | 26/03/2022 | 43 |
Data Standards (from Meta DfG)
-
Population sample - Displacement Maps only counts the number of Facebook mobile app users (across both Android and iOS versions) who have enabled the Location History setting.
-
Minimum Spatial Aggregation - Displacement maps report, at minimum, displacement events that occur at the city level (Pitney Bowes Level 3)
-
Temporal Aggregation - Movement between Administrative Regions is aggregated over single day time windows.
-
Update Frequency and Dataset Start Date - The start of the data set generation is triggered by either a Safety Check on the Facebook platform or a request to the Facebook Data for Good program. By default the data set is updated every day beginning on the 14th day after the trigger, however if additional time is required this can be requested. The data set is accessible for 90 days after the final update day and then is discarded.
-
Minimum Counts - If a city to city transition is below 10 facebook users we aggregate that transition and others to the country level. If that transition is still below 10 Facebook users, we report them as too few to report and do not provide a destination.
-
Crossing International Borders - We do not report the location of those that have been displaced across international borders. Instead we report them under the category “Displaced abroad”


ABOUT THE AUTHOR
Devanshu Bhardwaj serves as Nostos Homes’ Chief Design Officer. He has led the development of multiple innovative solutions that help make Nostos shelters accessible to some of the world’s most vulnerable and impacted displaced communities. His work has been recognized by global organisations such as the World Bank, IBM, and Saint Gobain. He is a passionate artist, and creates digital artwork almost everyday.